
Categories: Programming & Development

Recommended Apps for Java
-

Europe 10 Dec 10
-

Skype Lite (Samsung) 9 Mar 11
-

NetQin Mobile Antivirus 7 Feb 13
-

Sberbank Java 9 Feb 17
-

Play Market for Java 31 Jan 17
-

Angry Birds News on biNu 20 May 11
-

BOLT Browser (Java/BlackBerry) 28 Nov 11
-
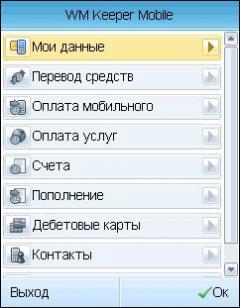
WM Keeper Mobile 1 Feb 17